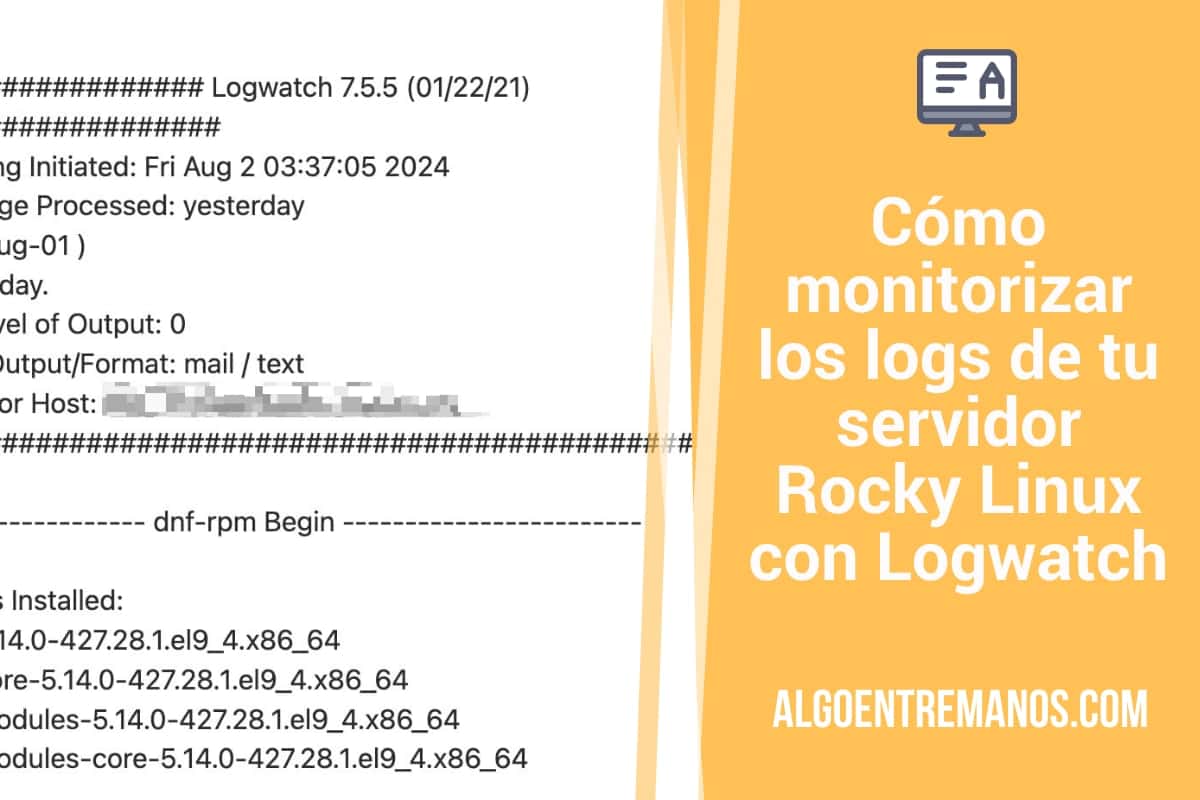
Logwatch es un programa que te va a mantener al tanto de todo lo que pase en tu servidor Linux analizando los logs del sistema y mandándote informes diarios a tu e-mail. Así ese sencillo y a la vez tan importante. Nadie quiere leerse interminables logs del sistema, pero un resumen todos los días a lo mejor no nos importa tanto. Vamos a ver cómo lo he instalado y configurado en Rocky Linux 9.
Instalamos logwatch en Rocky Linux
¡Ojo! Desde la versión 7.5.0 permite que se consulte el registro de systemd a través de journalctl.
#instalamos Logwatch
dnf install logwatch

#Copiamos el archivo de configuración original a una nueva localización para poder cambiarlo y respetar el original
sudo cp /usr/share/logwatch/default.conf/logwatch.conf /etc/logwatch/conf/
Configuramos el envío por email con Postfix
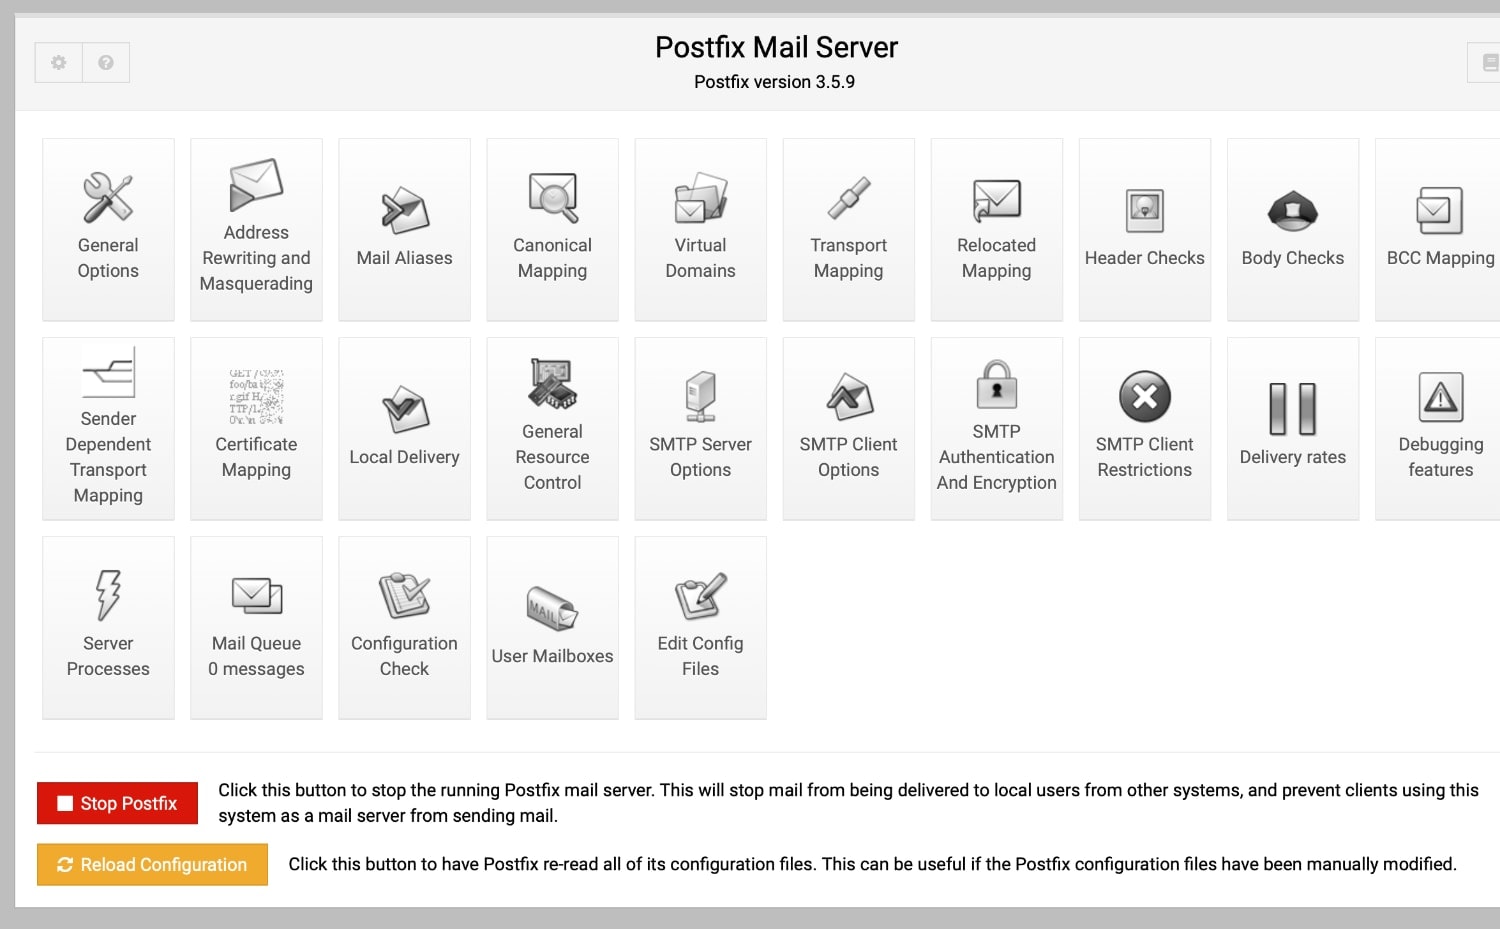
¡Ojo! Si quieres recibir los informes por e-mail vas a necesitar tener instalado algo como sendmail o Postfix en tu servidor. Si tienes instalado como yo, Virtualmin, Postfix ya viene instalado por defecto, pero tiene que estar bien configurado.
En el caso de Postfix, es muy importante que tengas bien configurados los siguientes parámetros en /etc/postfix/main.cf:
myhostname = hostname.ejemplo.com
inet_interfaces = loopback-only- Tienes que tener activos los registros A/AAAA y MX de tu dominio.
Y un alias en /etc/aliases:
root: tudireccionemail@domain.comAcuérdate de iniciar Postfix:
systemctl start postfixConfiguramos Logwatch
No modificamos el archivo de configuración por defecto, sino el que hemos copiado.
vi /etc/logwatch/conf/logwatch.conf
########################################################
# This was written and is maintained by:
#    Kirk Bauer <kirk@kaybee.org>
#
# Please send all comments, suggestions, bug reports,
#    etc, to kirk@kaybee.org.
#
########################################################

# NOTE:
#   All these options are the defaults if you run logwatch with no
#   command-line arguments.  You can override all of these on the
#   command-line.

# You can put comments anywhere you want to.  They are effective for the
# rest of the line.

# this is in the format of <name> = <value>.  Whitespace at the beginning
# and end of the lines is removed.  Whitespace before and after the = sign
# is removed.  Everything is case *insensitive*.

# Yes = True  = On  = 1
# No  = False = Off = 0

# You can override the default temp directory (/tmp) here
TmpDir = /var/cache/logwatch

#Output/Format Options
#By default Logwatch will print to stdout in text with no encoding.
#To make email Default set Output = mail to save to file set Output = file
Output = stdout
#To make Html the default formatting Format = html
Format = text
#To make Base64 [aka uuencode] Encode = base64
Encode = none

# Input Encoding
# Logwatch assumes that the input is in UTF-8 encoding.  Defining CharEncoding
# will use iconv to convert text to the UTF-8 encoding.  Set CharEncoding
# to an empty string to use the default current locale.  If set to a valid
# encoding, the input characters are converted to UTF-8, discarding any
# illegal characters.  Valid encodings are as used by the iconv program,
# and `iconv -l` lists valid character set encodings.
# Setting CharEncoding to UTF-8 simply discards illegal UTF-8 characters.
#CharEncoding = ""

# Default person to mail reports to.  Can be a local account or a
# complete email address.  Variable Output should be set to mail, or
# --output mail should be passed on command line to enable mail feature.
MailTo = tudirecciónemail@dominio.com
# WHen using option --multiemail, it is possible to specify a different
# email recipient per host processed.  For example, to send the report
# for hostname host1 to user@example.com, use:
#Mailto_host1 = user@example.com
# Multiple recipients can be specified by separating them with a space.

# Default person to mail reports from.  Can be a local account or a
# complete email address.
MailFrom = Logwatch

# if set, the results will be saved in <filename> instead of mailed
# or displayed. Be sure to set Output = file also.
#Filename = /tmp/logwatch

# Use archives?  If set to 'Yes', the archives of logfiles
# (i.e. /var/log/messages.1 or /var/log/messages.1.gz) will
# be searched in addition to the /var/log/messages file.
# This usually will not do much if your range is set to just
# 'Yesterday' or 'Today'... it is probably best used with Range = All
# By default this is now set to Yes. To turn off Archives uncomment this.
#Archives = No

# The default time range for the report...
# The current choices are All, Today, Yesterday
Range = yesterday

# The default detail level for the report.
# This can either be Low, Med, High or a number.
# Low = 0
# Med = 5
# High = 10
Detail = Low


# The 'Service' option expects either the name of a filter
# (in /usr/share/logwatch/scripts/services/*) or 'All'.
# The default service(s) to report on.  This should be left as All for
# most people.
Service = All
# You can also disable certain services (when specifying all)
Service = "-zz-network"     # Prevents execution of zz-network service, which
                            # prints useful network configuration info.
Service = "-zz-sys"         # Prevents execution of zz-sys service, which
                            # prints useful system configuration info.
Service = "-eximstats"      # Prevents execution of eximstats service, which
                            # is a wrapper for the eximstats program.
# If you only cared about FTP messages, you could use these 2 lines
# instead of the above:
#Service = ftpd-messages   # Processes ftpd messages in /var/log/messages
#Service = ftpd-xferlog    # Processes ftpd messages in /var/log/xferlog
# Maybe you only wanted reports on PAM messages, then you would use:
#Service = pam_pwdb        # PAM_pwdb messages - usually quite a bit
#Service = pam             # General PAM messages... usually not many

# You can also choose to use the 'LogFile' option.  This will cause
# logwatch to only analyze that one logfile.. for example:
#LogFile = messages
# will process /var/log/messages.  This will run all the filters that
# process that logfile.  This option is probably not too useful to
# most people.  Setting 'Service' to 'All' above analyzes all LogFiles
# anyways...

#
# By default we assume that all Unix systems have sendmail or a sendmail-like MTA.
# The mailer code prints a header with To: From: and Subject:.
# At this point you can change the mailer to anything that can handle this output
# stream.
# TODO test variables in the mailer string to see if the To/From/Subject can be set
# From here with out breaking anything. This would allow mail/mailx/nail etc..... -mgt
mailer = "/usr/sbin/sendmail -t"

#
# With this option set to a comma separated list of hostnames, only log entries
# for these particular hosts will be processed.  This can allow a log host to
# process only its own logs, or Logwatch can be run once per a set of hosts
# included in the logfiles.
# Example: HostLimit = hosta,hostb,myhost
#
# The default is to report on all log entries, regardless of its source host.
# Note that some logfiles do not include host information and will not be
# influenced by this setting.
#
#HostLimit = myhost

# Default Log Directory
# All log-files are assumed to be given relative to the LogDir directory.
# Multiple LogDir statements are possible.  Additional configuration variables
# to set particular directories follow, so LogDir need not be set.
LogDir = /var/log
#
# By default /var/adm is searched after LogDir.
#AppendVarAdmToLogDirs = 1
#
# By default /var/log is to be searched after LogDir and /var/adm/ .
#AppendVarLogToLogDirs = 1
#
# The current working directory can be searched after the above.  Not set by
# default.
#AppendCWDToLogDirs = 0

# vi: shiftwidth=3 tabstop=3 et
Necesitamos añadir nuestro e-mail al archivo de configuración de logwatch:
- MailTo = root la cambiamos por tudirecciónemail@dominio.com
- Elegimos el nivel de detalle de los informes. Vete probando. Con Low suele ser suficiente y en rango puedes poner solo los informes de ayer.
- Por defecto, Logwatch va a incluir todos los logs de /var/log. Si algún otro directorio de tu servidor contiene registros, se pueden agregar poniendo líneas adicionales de LogDir en la configuración.
- Lo demás lo puedes dejar como está.
¿Te pica la curiosidad por saber que está comprobando Logwatch y como lo hace? Solo tienes que ir a la carpeta:
ls -l /usr/share/logwatch/scripts/servicesY allí verás una lista detallada de los scripts de Logwatch destinados a analizar diferentes servicios del sistema.
¿Quieres ejecutar tu primer informe desde la línea de comandos? Puedes poner lo siguiente:
logwatch --detail Low --mailto tudirecciónemail@dominio.com --range todaySi pones en el Terminal man logwatch, tienes todas las opciones de configuración y uso, pero básicamente:
 logwatch  [--detail  level  ]  [--logfile log-file-group ] [--service service-name ] [--mailto address ] [--archives] [--range range ] [--debug
       level ] [--filename file-name ] [--logdir directory ] [--hostlimit hosts ] [--hostname hostname ] [--html_wrap number of characters ]  [--host‐
       format  host  based  options  ] [--output output-type ] [--format report format ] [--subject email subject ] [--encode encoding to use ] [--nu‐
       meric] [--version] [--help|--usage]
Si quieres consultar una guía con toda la configuración, está situada en: less /usr/share/doc/logwatch/HOWTO-Customize-LogWatch
¿Hace falta crear un cron para que se ejecute el informe todos los días? Pues el mismo paquete instala un cron en /etc/cron.daily/0logwatch:
#!/usr/bin/sh

#Set logwatch executable location
LOGWATCH_SCRIPT="/usr/sbin/logwatch"

# Add options to the OPTIONS variable. Most options should be defined in
# the file /etc/logwatch/conf/logwatch.conf, but some are only for the
# nightly cron run such as "--output mail" and should be set here.
# Other options to consider might be "--format html" or "--encode base64".
# See 'man logwatch' for more details.
OPTIONS="--output mail"

#Call logwatch
$LOGWATCH_SCRIPT $OPTIONS

exit 0
Pero si ves que no te funciona, puedes crear uno tú mismo con los siguientes comandos:
#Entras en el cron
crontab -e

#Añades lo siguiente
30 0  * * *          /usr/sbin/logwatch
¿Qué tipo de e-mail vas a recibir todos los días? Puedes penden el nivel de detalle que hayas configurado. En el caso de Low, puedes ver algo como esto:
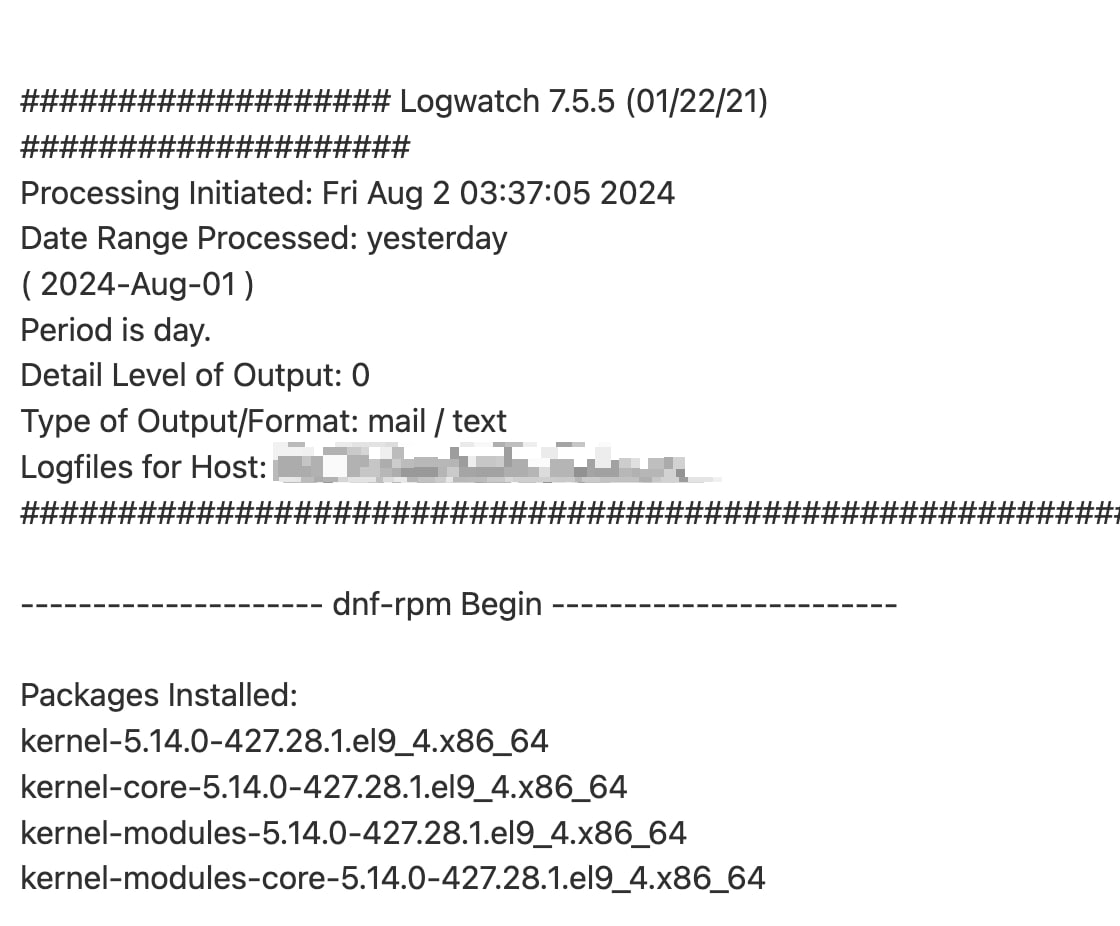
Como puedes ver, empieza por cosas importante, como la instalación de nuevos paquetes en el servidor, pero luego hay secciones de iptables firewall, warnings del kernel, autenticaciones de pam_unix, datos de Postfix, Connections, SSHD, Sudo, Disk Space o datos de Systemd.
Comando para consultar logs en la Terminal
De cualquier manera, siempre puedes utilizar unos cuantos comandos útiles en tu Terminal cuando accedes por SSH al servidor para consultar los logs más importantes (probado en Rocky Linux 9 con journalctl para ver logs del sistema gestionados por systemd):
# Muestra las últimas 100 líneas de mensajes de prioridad entre alert y emerg (máxima severidad)
journalctl --lines 100 -p alert..emerg

# Muestra las últimas 100 líneas de mensajes de prioridad entre err y crit (errores y condiciones críticas)
journalctl --lines 100 -p err..crit

# Muestra las últimas 100 líneas de mensajes de prioridad entre notice y warning (avisos y advertencias)
journalctl --lines 100 -p notice..warning

# Muestra las últimas 100 líneas de mensajes de prioridad entre debug e info (mensajes de depuración e informativos)
journalctl --lines 100 -p debug..info

# Muestra las últimas 100 líneas de mensajes del kernel
journalctl --lines 100 -k

# Muestra las últimas 100 líneas de todos los mensajes con explicaciones adicionales (si están disponibles)
journalctl --lines 100 -x

# Muestra las últimas 100 líneas de todos los mensajes sin importar la prioridad
journalctl --lines 100
¿Otros logs que debes vigilar en tu servidor?
# Contiene todos los mensajes de información (info) y mayor severidad,
/var/log/messages

# Contiene todos los mensajes relacionados con la autenticación privada
/var/log/secure

# Contiene todos los mensajes relacionados con el correo
/var/log/maillog

# Contiene todos los mensajes relacionados con el cron
/var/log/cron

# Contiene mensajes críticos relacionados con uucp y news
/var/log/spooler

# Log de errores de Apache, utilizado para registrar errores del servidor web
/etc/httpd/logs/error_log
¡Consejo! Es fundamental que tengas activo y bien configurado logrotate en tu servidor para que los logs no se coman el almacenamiento de tu servidor Rocky Linux. Está instalado por defecto.
En /etc/logrotate.conf tienes la configuración defecto:
# see "man logrotate" for details

# global options do not affect preceding include directives

# rotate log files weekly
weekly

# keep 4 weeks worth of backlogs
rotate 4

# create new (empty) log files after rotating old ones
create

# use date as a suffix of the rotated file
dateext

# uncomment this if you want your log files compressed
#compress

# packages drop log rotation information into this directory
include /etc/logrotate.d

# system-specific logs may be also be configured here.
/var/log/procmail.log {
        rotate 5
        daily
        compress
}
En /etc/logrotate.d/ tienes las configuraciones de rotación de logs de algunos programas. Si no encuentras el que te interesa tienes que crearlo. Mira, por ejemplo el de httpd (Apache):
# Note that logs are not compressed unless "compress" is configured,
# which can be done either here or globally in /etc/logrotate.conf.
/var/log/httpd/*log {
    missingok
    notifempty
    sharedscripts
    delaycompress
    postrotate
        /bin/systemctl reload httpd.service > /dev/null 2>/dev/null || true
    endscript
}
O el de MariaDB:
# This logname can be set in /etc/my.cnf
# by setting the variable "log-error"
# in the [mysqld] section as follows:
#
# [mysqld]
# log-error=/var/log/mariadb/mariadb.log

/var/log/mariadb/mariadb.log {
        create 600 mysql mysql
        su mysql mysql
        notifempty
        daily
        rotate 3
        missingok
        compress
        delaycompress
        sharedscripts
    postrotate
        # just if mariadbd is really running
        if [ -e /run/mariadb/mariadb.pid ]
        then
           kill -1 $(</run/mariadb/mariadb.pid)
        fi
    endscript
}
Referencias: